Choose an LLM API using your input-to-output ratio
Calculate provider crossover points and see why a lower input price can still produce a higher bill for output-heavy work.

The cheaper LLM API depends on the balance between input and output tokens. If one provider has a lower input rate and a higher output rate, neither provider wins for every workload. Calculate the total for your own token mix, then check whether caching, minimum charges, or a different model contract changes the comparison. A single discount percentage cannot answer that question by itself.
This guide develops an original arithmetic model using explicitly hypothetical rates. These examples are not current offers, quality benchmarks, or measured customer workloads. For actual offers, use the published price table and inspect the verification date on each model. The gateway comparison page identifies exceptions rather than claiming that Meldport is always the cheapest provider.
Turn two prices into one workload cost
Define r as output tokens divided by input tokens. For one million input tokens, r million output tokens cost Pi + r × Po, where Pi and Po are prices per million. If a task has 200,000 input and 20,000 output tokens, r is 0.1. If it has 20,000 input and 40,000 output tokens, r is 2. Both workloads have different sensitivities to the two price columns.
Use this ratio only after confirming the units. The OpenRouter public model catalog provides listed pricing fields, while the Meldport comparison displays dollar rates per million tokens. Converting a per-token rate into a per-million rate requires multiplication by one million. A denominator error can overwhelm the provider difference you intended to investigate.
Work through a crossover before choosing a provider
Assume provider A charges $0.20 input and $2.00 output per million tokens. Provider B charges $0.50 input and $1.00 output. A has the better input rate; B has the better output rate. Set their costs equal: 0.20 + 2r = 0.50 + r. Subtract r and then subtract 0.20. The crossover occurs at r = 0.30.
Below that ratio, A has a lower token subtotal for this hypothetical pair. Above it, B has a lower subtotal. At exactly 0.30, both cost $0.80 for one million input and 300,000 output tokens. The result is specific to those four assumed rates. Do not carry the same crossover into a different model, a cached workload, or another provider's pricing tier.
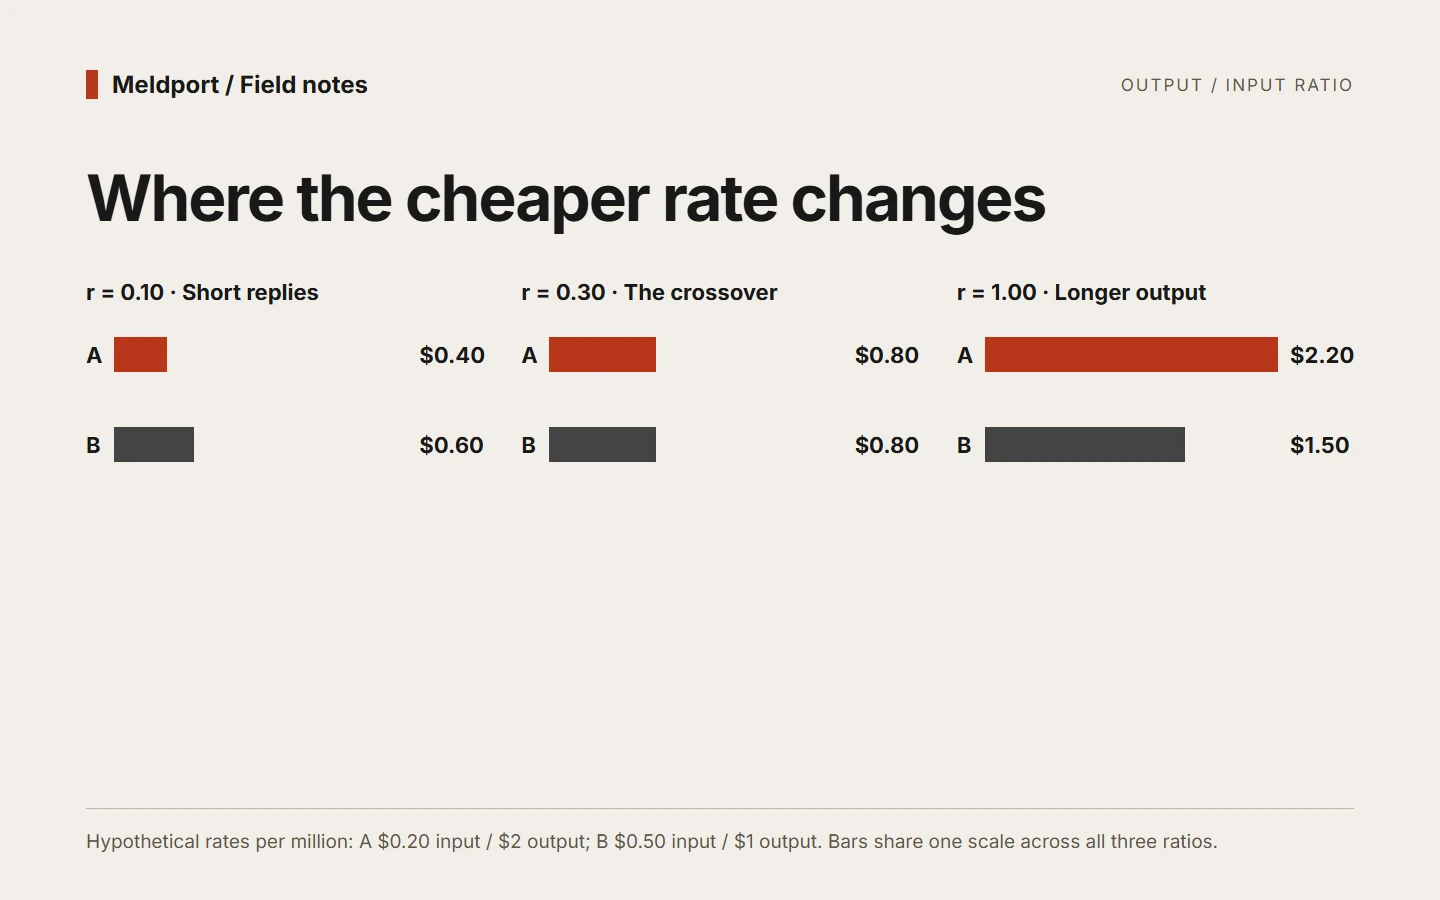
Worked example: an illustrative ratio curve. All costs assume one million uncached input tokens.
| Output/input ratio | Output tokens | Provider A | Provider B | Lower subtotal |
|---|---|---|---|---|
| 0.05 | 50,000 | $0.30 | $0.55 | A |
| 0.10 | 100,000 | $0.40 | $0.60 | A |
| 0.30 | 300,000 | $0.80 | $0.80 | Equal |
| 1.00 | 1,000,000 | $2.20 | $1.50 | B |
| 2.00 | 2,000,000 | $4.20 | $2.50 | B |
Handle the other possible price relationships
Not every comparison needs a crossover. If A has both a lower input rate and a lower output rate, its uncached token subtotal is lower for every nonnegative token mix under that exact price contract. This remains a statement about token prices, not about task quality or total operational cost. If one model takes more attempts, the workload itself has changed.
When output prices are equal, compare input prices for any workload with input tokens. When input prices are equal, compare output prices for any workload with output tokens. If both are equal, token rates provide no basis to prefer either provider. These simple cases are worth checking before applying a formula with a zero denominator or interpreting an irrelevant negative crossover.
Deciding which calculation is needed. The labels concern uncached token subtotals only.
| Price relationship | Necessary calculation | Practical interpretation |
|---|---|---|
| A lower on both sides | Multiply either rate pair by actual counts | A has the lower comparable subtotal |
| A lower input, higher output | Solve the crossover and compare r | Workload mix decides |
| Same output price | Compare input price and input count | No output-driven crossover |
| Same input price | Compare output price and output count | Output subtotal decides |
| Same two prices | Compare non-price requirements separately | Rates are tied |
Measure ratios across complete agent loops
For a coding agent, do not calculate r from only the final answer. Add the input and output of the requests that produced that accepted result. Tool definitions, file excerpts, diagnostic output, and prior conversation can change the input total. A short visible answer may therefore belong to a task with substantial input consumption, while a generated file can produce a much larger output total.
Start with a ledger organized by task and request. Sum tokens by direction, divide total output by total input, and preserve the task's acceptance result. If one request is unresolved, mark the task's ratio provisional rather than treating the missing counts as zero. The cost-per-task guide shows how to keep request evidence and billing evidence separate.
Do not average ratios without thinking about weights
Suppose task X uses 1,000 input tokens and 1,000 output tokens, so its ratio is 1. Task Y uses 99,000 input and 9,000 output tokens, giving a ratio of approximately 0.091. The simple average of those two ratios is about 0.545. Yet the combined workload has 100,000 input and 10,000 output tokens, so its actual aggregate ratio is 0.10.
For a combined token budget, use the aggregate counts. The unweighted average lets a tiny task influence the result as much as a large one. You may still want per-task ratios to understand different behaviors, but they answer a different question. Keep both views labeled so that a report about request patterns is not accidentally used as a bill forecast.
Check sensitivity around your expected workload
A crossover very close to your observed ratio deserves more caution than a large price difference. A modest change in generated answer length or repeated context can reverse the comparison. Instead of selecting one ratio and hiding uncertainty, calculate a low-output case, a central case, and a high-output case. Treat the spread as a scenario range unless you have enough observations to characterize it statistically.
Do not call an observed maximum a guaranteed upper bound. A new task can require more context, another attempt, or a longer answer than your earlier sample. You can set your own request budgets and stop conditions, then verify how the client and gateway enforce them. A planned output cap belongs in the workload assumptions; it is not evidence that every task can finish within that cap.
An illustrative sensitivity plan using the earlier hypothetical providers. These are planning choices, not measured probabilities.
| Scenario | Assumed r | A per million input | B per million input | What to inspect |
|---|---|---|---|---|
| Short replies | 0.10 | $0.40 | $0.60 | Whether answers remain acceptable |
| Near crossover | 0.25 | $0.70 | $0.75 | Small changes in output length |
| Longer generation | 0.50 | $1.20 | $1.00 | Generated files and repair turns |
Define exactly what counts as input and output
Use the usage schema for the selected endpoint before comparing totals. The Gemini token-counting documentation distinguishes counting input before a request from inspecting usage after generation. A preflight estimate is useful for deciding whether to submit work. It cannot tell you how much output a model will produce, and a plain-text estimate cannot establish the complete cost of an unrelated multimodal request.
Keep images, audio, video, reasoning, and other separately reported usage categories explicit when the chosen model supports them. Check its published billing contract rather than assuming that the visible answer contains every billed output token. The Gemini pricing documentation includes model-specific distinctions; the relevant row and request mode matter. This article's two-column examples deliberately assume ordinary uncached text input and output, so they should not be copied unchanged into a different billing scheme.
A useful comparison record has four parts: the raw usage fields, the mapping into billable categories, the dated rate for each category, and the resulting subtotal. Store this mapping with the spreadsheet. If another developer cannot reconstruct the ratio from the same response, settle that disagreement before comparing providers. Otherwise two apparently precise ratios may simply use different definitions of input.
Turn the ratio into an application decision
Group tasks by behavior before selecting a default. A retrieval-heavy assistant may repeatedly send source documents and generate short answers. A file generator may send a small brief and return long outputs. Mixing both into one aggregate ratio is appropriate for a combined bill forecast, but it can hide an opportunity to evaluate each workflow separately. Keep those segments tied to a stable task label rather than guessing the category from the final answer length.
For each segment, write down a minimum acceptable result, a required capability, and the token mix. Then evaluate a candidate on the same task set. If a lower output rate comes with more repair turns, add those requests before comparing the totals. The ratio calculation is a way to explain a measured bill, not a substitute for deciding whether the output is usable.
Use a simple decision sheet with a row for each candidate. Include the planned monthly volume and the dollar difference, alongside the cache assumptions and unresolved items. For example, a hypothetical saving of $0.02 per accepted task becomes $20 across 1,000 comparable tasks. Whether that saving justifies another integration depends on your requirements and operating effort. The arithmetic does not assign a value to those factors, so make that judgment separately and record the owner of the decision.
Keep caching and capability differences visible
Before using a computed crossover, verify its direction with two concrete calculations. Substitute a ratio below the crossover into both provider equations, then substitute one above it. This catches a sign error without requiring anyone to trust the algebra. If your calculation says A wins below the boundary but the worked subtotal says otherwise, correct the equation or the interpretation before making a purchase decision.
Also record the scale of the saving. A small percentage difference on a tiny workload may be less important to your application than a required capability or an unresolved charge. A larger workload makes the same rate difference more consequential, but does not remove the need to validate behavior. Show both the dollar difference for the planned volume and the assumptions that created it, so the person deciding can judge its practical significance.
If some input is billed at a cache rate, the effective input price changes. Calculate the cached and uncached components explicitly rather than applying the uncached crossover to an entirely different bill. The workload calculator accepts ordinary and cached input separately and rejects an unknown cache rate. It applies Meldport's combined-input rounding, separate output rounding and per-request minimum before multiplying monthly requests. Those rules can matter for many tiny requests. Splitting a task into smaller requests may change the adjustment even when token totals remain similar. Its downloadable catalog snapshot records units, observation time and evidence dates so a spreadsheet can preserve the rates used.
Token prices also do not establish that two endpoints support the same client protocol, tool behavior, or context limit. The OpenCode provider documentation, for example, distinguishes a Chat Completions-compatible adapter from a Responses-oriented adapter. Keep such compatibility checks ahead of the cost calculation: an endpoint your client cannot use has no meaningful savings for that task.
When presenting the result to someone else, include the exact model IDs, the two source URLs, evidence dates, token units, cache assumptions, and the acceptance rule. Show at least one worked subtotal so the arithmetic is inspectable. Then phrase the conclusion conditionally: this provider has the lower comparable token subtotal for this workload and these rates. That is more useful than an unconditional cheapest-provider claim, and it remains understandable when the catalog changes tomorrow.